

Monitoring of your application and infrastructure is crucial in today’s dynamic environment. Prometheus is a powerful tool that has been in production for the past few years at some of the world’s most critical infrastructure companies like SoundCloud. It is an open-source monitoring system and time-series data. The main objective of Prometheus is to provide a flexible monitoring solution that is able to collect and process large amounts of time series data quickly. Although Prometheus is written in Go, it can be used to monitor any kind of process via remote client libraries. In this tutorial, we’re going to see how to monitor Python scripts using Prometheus.
The Python programming language is growing in popularity and used across all industries. As a result of this, enterprising developers are building tools focused on helping out with monitoring any Python software – like Prometheus. In this tutorial, we’ll look more into what Prometheus does and how it can help you gather the information as well as how to monitor Python scripts using Prometheus.
What is Prometheus?
Prometheus is an open-source monitoring and alerting toolkit originally built by SoundCloud. It uses a time-series database to store metric data, where you can query metrics on all of your servers or just a subset, and perform alerting on metrics that you think are important. It can be used to monitor everything from network latency and disk I/O to the number of active users on a site. Prometheus has a simple and intuitive configuration file format and is capable of scaling to thousands of hosts and metrics. It is easy to install and has many integrations for tools such as Grafana.
What can Prometheus monitor?
Getting metrics using Prometheus is usually rather easy. We use a few lines of code to make this possible whether it’s a get request or a query to the database or local cache etc., and you can easily set them up with your existing stack.
Prometheus supports the following 4 types of metrics:
- Counter: It is a means of counting numbers. It helps you to keep track of things from increasing or just resetting to 0 in general.
- Gauge: It is a numeric metric commonly used to track values such as performance metrics.
- Info: It is used for static information such as a version of the application and/or an ‘enum’ to show the status of the application.
- Histogram: The use of histograms is instrumental to tracking and analyzing the duration, volume, and frequency of things like requests.
Building a basic Prometheus watcher
For simplicity’s sake, we’ll only be using the gauge metric in this project.
First, you’ll have to install the Prometheus client for Python specifically, you can do that with the following command or you can also find this package on PyPI.
pip install prometheus-clientThen, create a .py file, you can name it whatever you want, and paste the following code in it. Also, anything you would want to know about the code is predefined in it as comments.
import prometheus_client as prom  #import 'prometheus_client', this is important as the python Prometheus library is called that

#these two packages are for creating the extra metrics in the sample
from random import randrange
import time

#here we are defining the gauge, it has only one metric, which is, for just to generate a number
RANDOM_NUMBER_GAUGE = prom.Gauge('rendom_number_gauge', 'Random number between 1 - 100')

#this is the function to generate random numbers based on our Gauge and displays the whole thing on the page
def generate_random_numbers():
    while True:
        random_number = randrange(10)
        RANDOM_NUMBER_GAUGE.set(random_number)
        time.sleep(5)  #this sleep function defines, in how much time will our Gauge update the metrics


if __name__ == '__main__':  #this is the closing function
    prom.start_http_server(8000)  #and here are starting our server with the Prometheus client itself to post our results
    generate_random_numbers()
After creating the file, run the following command to start the application:
python3 main.py
#python3 <your_file_name>
If you get no errors after running it, means it started successfully. That may sound weird, but that is how it works. Now, as you can see in the code, we have defined the server to start at port 8000. Go there using this link http://127.0.0.1:8000/ and you should get a result like this:
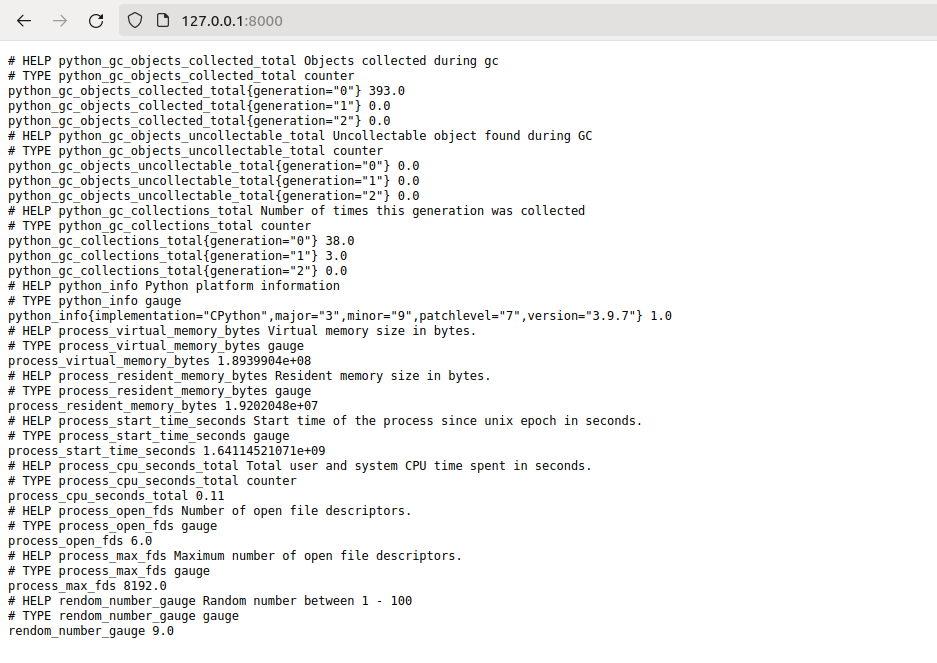
Now, as you can see, these metrics can now be tracked and used by Prometheus. All the information is labeled with a comment above it, so you can figure out what is what easily. We have also got our random number generator at the very bottom, working as expected:

There’s a variety of ways we can use this information: For example, when tuning a service, you could use the gauge to view how latency changes as you make changes, which could inform you how to make further adjustments to fix problems.
Building a Prometheus website watcher
Now that we know how does Prometheus fundamentally works, we can also apply a label to a service, which would be a component of our Prometheus application, in order to make differentiating the metrics between services easier. e.g. if the same metric is relevant for multiple different services. With that, if we want to check the metrics on multiple websites, we can use the same gauge and add a label signifying the site we measured from.
To create such a watcher, create a new file and paste the following code into it. Its contents are also explained in the comments.
import prometheus_client as prom
import requests
import time

#here we have defined the gauge, it also has only one metric, which is to show the ms load time of websites
RESPONSE_TIME_GAUGE = prom.Gauge('sample_external_url_response_ms', 'Url response time in ms', ["url"])
URL_LIST = ["https://github.com", "https://google.com"]  #here we have defined what sites we want our appliction to monitor


#this function monitor’s how much time do the mentioned sites take to load
def get_response(url: str) -> dict:
    response = requests.get(url)
    response_time = response.elapsed.total_seconds()
    return response_time

#this function displays the results properly on the web page
def get_url_status():
    while True:
        for url_name in URL_LIST:
            response_time = get_response(url_name)
            RESPONSE_TIME_GAUGE.labels(url=url_name).set(response_time)
        time.sleep(5)


if __name__ == '__main__':
    prom.start_http_server(8000)
    get_url_status()
You can run it similarly to how we did for the other file:
python3 main.py
#python3 <your_file_name>
Again, if it started successfully, open the result page using the link http://127.0.0.1:8000/ and you should get a result like this:
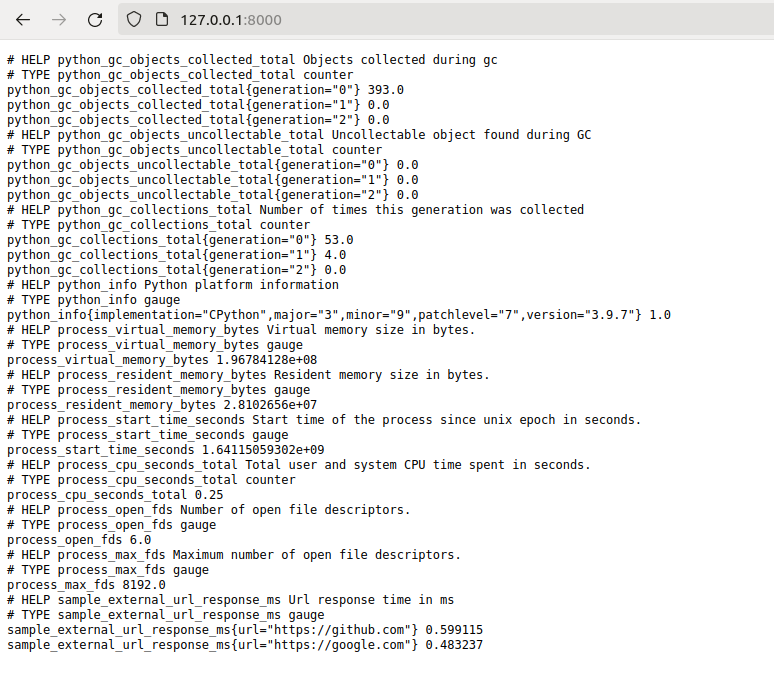
Here also you would get all the usual metrics, along with the external websites load times which you can see below:
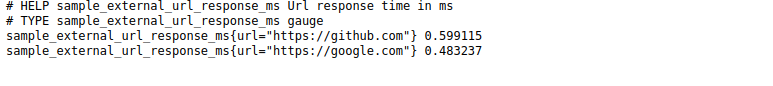
As you can we do get the load time results on the defined sites, which could be very useful in a lot of situations, whether it is in a production or development environment. You can easily replace the website’s link with whatever you want, whether it is on a public domain or on a local host!
Conclusion
It is important to understand what is happening in your application and infrastructure. Monitoring is the key to ensuring that your business can adapt to changes in markets, technology, and resources. Prometheus is an excellent open-source solution that allows you to collect and monitor time-series data in a number of ways. In this tutorial, we have only covered the very basics of Prometheus, but it has a plethora of different and powerful monitoring solutions that you can utilize. If you want to learn more about it, then you should definitely check out their documentation.
Here are some useful tutorials that you can read:
- Concurrency in Python
- How to receive Github webhooks in Python?
- Convert an image to 8-bit image
- How to run my Python script on Docker?
- Generating QR Codes and Barcodes in Python
- Create API in Django Rest Framework Viewset
- Create Sudoku game in Python using Pygame
- Get Weather Information using Python
- Detect the number of faces using Python and OpenCV